Document Fraud in Numbers: What the Data Actually Says
Every figure attributed to the body that published it, with a note on what it really measures — plus the widely-quoted statistics that do not survive a look at their sources, and a thirty-second test for any fraud number you are handed.
Every vendor in this market, us included, is tempted to open a pitch with a large number. The numbers are real enough. What almost never survives the trip from the original report to the slide is what was counted, and that is where the meaning lives.
So this is a statistics page written the other way round. Each figure below is attributed to the organisation that published it, with a link to the primary source and a note on what the number actually measures. Where a widely-repeated statistic does not hold up to that treatment, we say so. If you are citing any of this, cite the original.
Key takeaways
- Reported losses are a floor, not a total. Most fraud is never reported, and every source below measures only what reached it.
- Survey figures ("X% of organisations experienced fraud") come from self-selected respondents and describe attempts, not successful losses.
- Vendor telemetry ("document forgeries rose N%") measures what that vendor's customers submitted, which moves with their customer base as well as with fraud.
- Direction of travel is more trustworthy than magnitude. Several independent sources agree that document fraud has shifted from physical counterfeiting to digital manipulation, and that agreement is the sturdiest finding here.
Reported cybercrime losses
The FBI's Internet Crime Complaint Center reported $20.9 billion in total losses across 1,008,597 complaints in 2025, the first year complaint volume passed one million, and a 26% rise in losses on the prior year. Business email compromise accounted for $3.0 billion across 24,768 incidents, an average of roughly $123,000 per case. Investment fraud was the single largest category at $8.6 billion. (IC3 2025 Internet Crime Report)
What it measures: complaints voluntarily filed with a US federal agency. It excludes fraud that was absorbed quietly, settled commercially, never recognised, or reported to a different body. Treat it as a directional floor for the US only.
Why the BEC average matters more than the total: $123,000 per incident is the number to put in front of a finance team, because it is the size of one bad afternoon rather than an abstraction. And BEC is a documents problem as much as an email problem — the invoice, the letterhead, the bank-change notice are what make the request believable.
Payments fraud in businesses
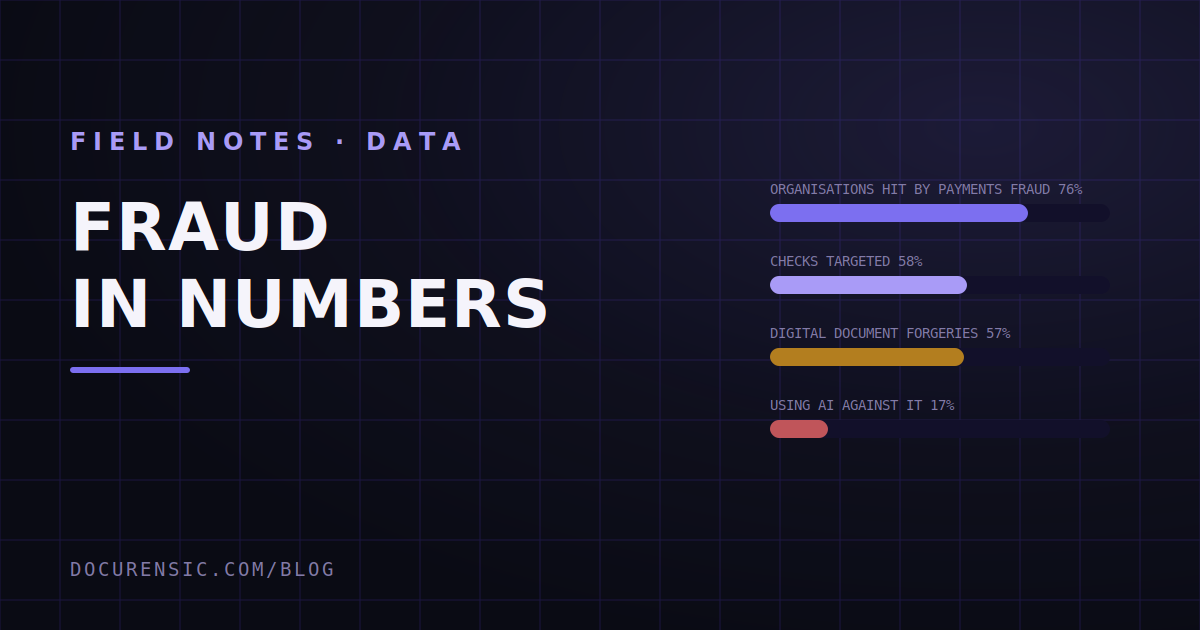
The Association for Financial Professionals' 2026 survey, conducted in January 2026 among 465 US treasury practitioners, found 76% of organisations experienced attempted or actual payments fraud in 2025. Checks remained the most-targeted instrument at 58%, ahead of ACH debits at 30% and wire transfers at 25%. 74% reported being affected by business email compromise. Only 17% were using AI in any form against payments fraud. (2026 AFP Payments Fraud and Control Survey)
What it measures: self-reported experience of attempts, from a sample of professionals engaged enough to answer an industry survey. It is not a loss rate — an attempt that a control caught counts the same as one that succeeded, which is arguably the right way round for a survey about controls.
The durable finding: checks have been the most defrauded instrument in this survey for years running, in an era when nearly everyone assumes the risk has moved online. Paper is not a solved problem.
Occupational fraud
The ACFE's Occupational Fraud 2026: A Report to the Nations analysed 2,402 cases across 143 countries, totalling more than $3.4 billion in losses with a median loss of $104,000 per case. Schemes caught within six months had a median loss of $40,000; those running more than five years exceeded $1.1 million. Asset misappropriation appeared in 90% of cases. (ACFE Report to the Nations)
What it measures: cases investigated by Certified Fraud Examiners — so, by construction, fraud that was found, and found by a professional. Undiscovered fraud is definitionally absent.
The number worth remembering: the loss curve against duration. It is the strongest available argument that detection speed, not detection sophistication, is what determines cost. A control that catches something mediocre in month two beats a brilliant control that fires in year four.
Document forgery has gone digital
Entrust's 2025 Identity Fraud Report, drawing on Onfido's verification telemetry for 2024, found that digital document forgeries overtook physical counterfeits for the first time, reaching 57% of all document fraud — a 244% year-on-year increase, and roughly a sixteen-fold rise since 2021, when almost all fraudulent documents submitted were physical fakes. National ID cards were the most-attacked document type at 40.8% globally. The same report recorded a deepfake attempt roughly every five minutes. (Entrust 2025 Identity Fraud Report)
What it measures: documents submitted to one large identity-verification provider. The mix reflects that provider's customers and the fraud aimed at them. A percentage-of-total shift like 57% is more robust than a growth rate, because growth rates move when the customer base moves.
Why we cite it anyway: the direction is corroborated elsewhere. Sumsub's fraud reporting over the same period describes the same migration — from counterfeit plastic to manipulated files and AI-assisted synthetics. Two providers with different customer bases seeing the same shift is a real signal, even if neither percentage should be quoted to the decimal.
The statistics you should be careful with
"90% of fraud involves document manipulation" and its many cousins. We have never been able to trace a figure of this shape to a primary source. It is repeated across vendor blogs — ours has been asked to include it — and it appears to be a paraphrase that hardened into a citation. Do not use it.
Deepfake growth rates in the thousands of percent. Arithmetically true and close to meaningless: a rise from 0.1% to 6.5% of attempts is a 6,400% increase and also a rise from rare to uncommon. Quote the base rates.
Anything about "AI-generated documents" without a definition. The category is being counted differently by everyone measuring it. A wholly synthesised statement, a real statement with one AI-edited figure, and a template filled in by a language model are three different problems with three different detection profiles.
Losses "expected to reach" a future figure. These are projections, usually from consultancies, and they are frequently cited as though they were measurements.
How to read any fraud statistic in thirty seconds
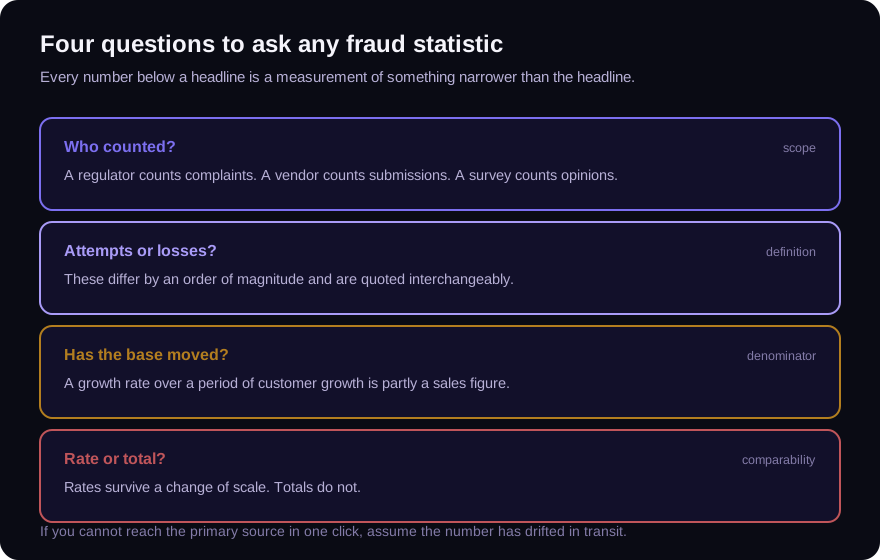
- Who counted, and what reaches them? A regulator counts complaints, a vendor counts submissions, a survey counts opinions.
- Attempts or losses? These differ by an order of magnitude and get used interchangeably.
- What period, and has the base moved? A growth rate over a period when the source added customers is partly a sales figure.
- Is it a rate or a total? Rates survive scale changes. Totals do not.
- Can you reach the primary source in one click? If not, assume the number has drifted.
What we do not publish
We have deliberately kept our own detection rates off this page. We could quote the proportion of documents our engine flags, and it would be a real number from a real corpus — but it would describe the mix of files our customers happen to send us, not the world, and presenting it as an industry statistic would be exactly the behaviour this article criticises.
If you want to know how well a tool performs on documents like yours, the answer is not any vendor's published number. It is a test you run yourself on your own material, which is a whole procedure we have written up separately in how to test a document-forensics tool before you buy it.
Frequently asked questions
How much does document fraud cost businesses each year?
There is no defensible single figure, because no one counts document fraud as its own category. The nearest anchors are the FBI's $20.9 billion in reported US cybercrime losses for 2025 and the ACFE's $104,000 median loss per occupational fraud case — both floors, both measuring something narrower than "document fraud".
Is document fraud increasing?
The evidence points that way, and the clearer finding is that it has changed shape. Identity-verification providers report digital manipulation overtaking physical counterfeiting, with digital forgeries reaching 57% of document fraud in 2024 by Entrust's count. Volume claims are less reliable than that compositional shift.
What percentage of fraud involves forged documents?
Nobody knows, and any specific figure you see quoted for this is almost certainly untraceable to a primary source. Documents are the instrument in a large share of payment, lending, insurance and hiring fraud, but the statistics are collected by scheme type rather than by instrument.
Where can I find primary sources for fraud statistics?
The FBI's IC3 annual Internet Crime Report, the ACFE's biennial Report to the Nations, the AFP Payments Fraud and Control Survey, and the annual identity-fraud reports published by the larger verification providers. Each publishes methodology alongside the numbers, which is what makes them worth citing.
Check the PDF you are holding
Run a free PDF X-Ray in your browser — it recovers text from the file’s earlier revisions, so you can see what a value was before it was changed. No account needed.
Keep reading

The Fake-Document Economy: Inside the Template and Generator Industry
Pay stubs in 60 seconds, bank statements to order, "novelty" diplomas — an entire industry sells document fraud as a service. How the template economy works and what its products have in common.

The Two-Invoice Trade: Customs Undervaluation and the Paper That Hides It
Undervalued commercial invoices dodge duties, launder value, and expose importers to seizure. How the double-invoice game works and how compliance teams catch it in the paper.
Fake Audit Reports: Borrowing a Big Four Signature
Fabricated audit opinions and doctored financial statements borrow credibility no fraudster earned. How fake audits are built, famous ways they unravel, and how to verify one.